Blog Archives
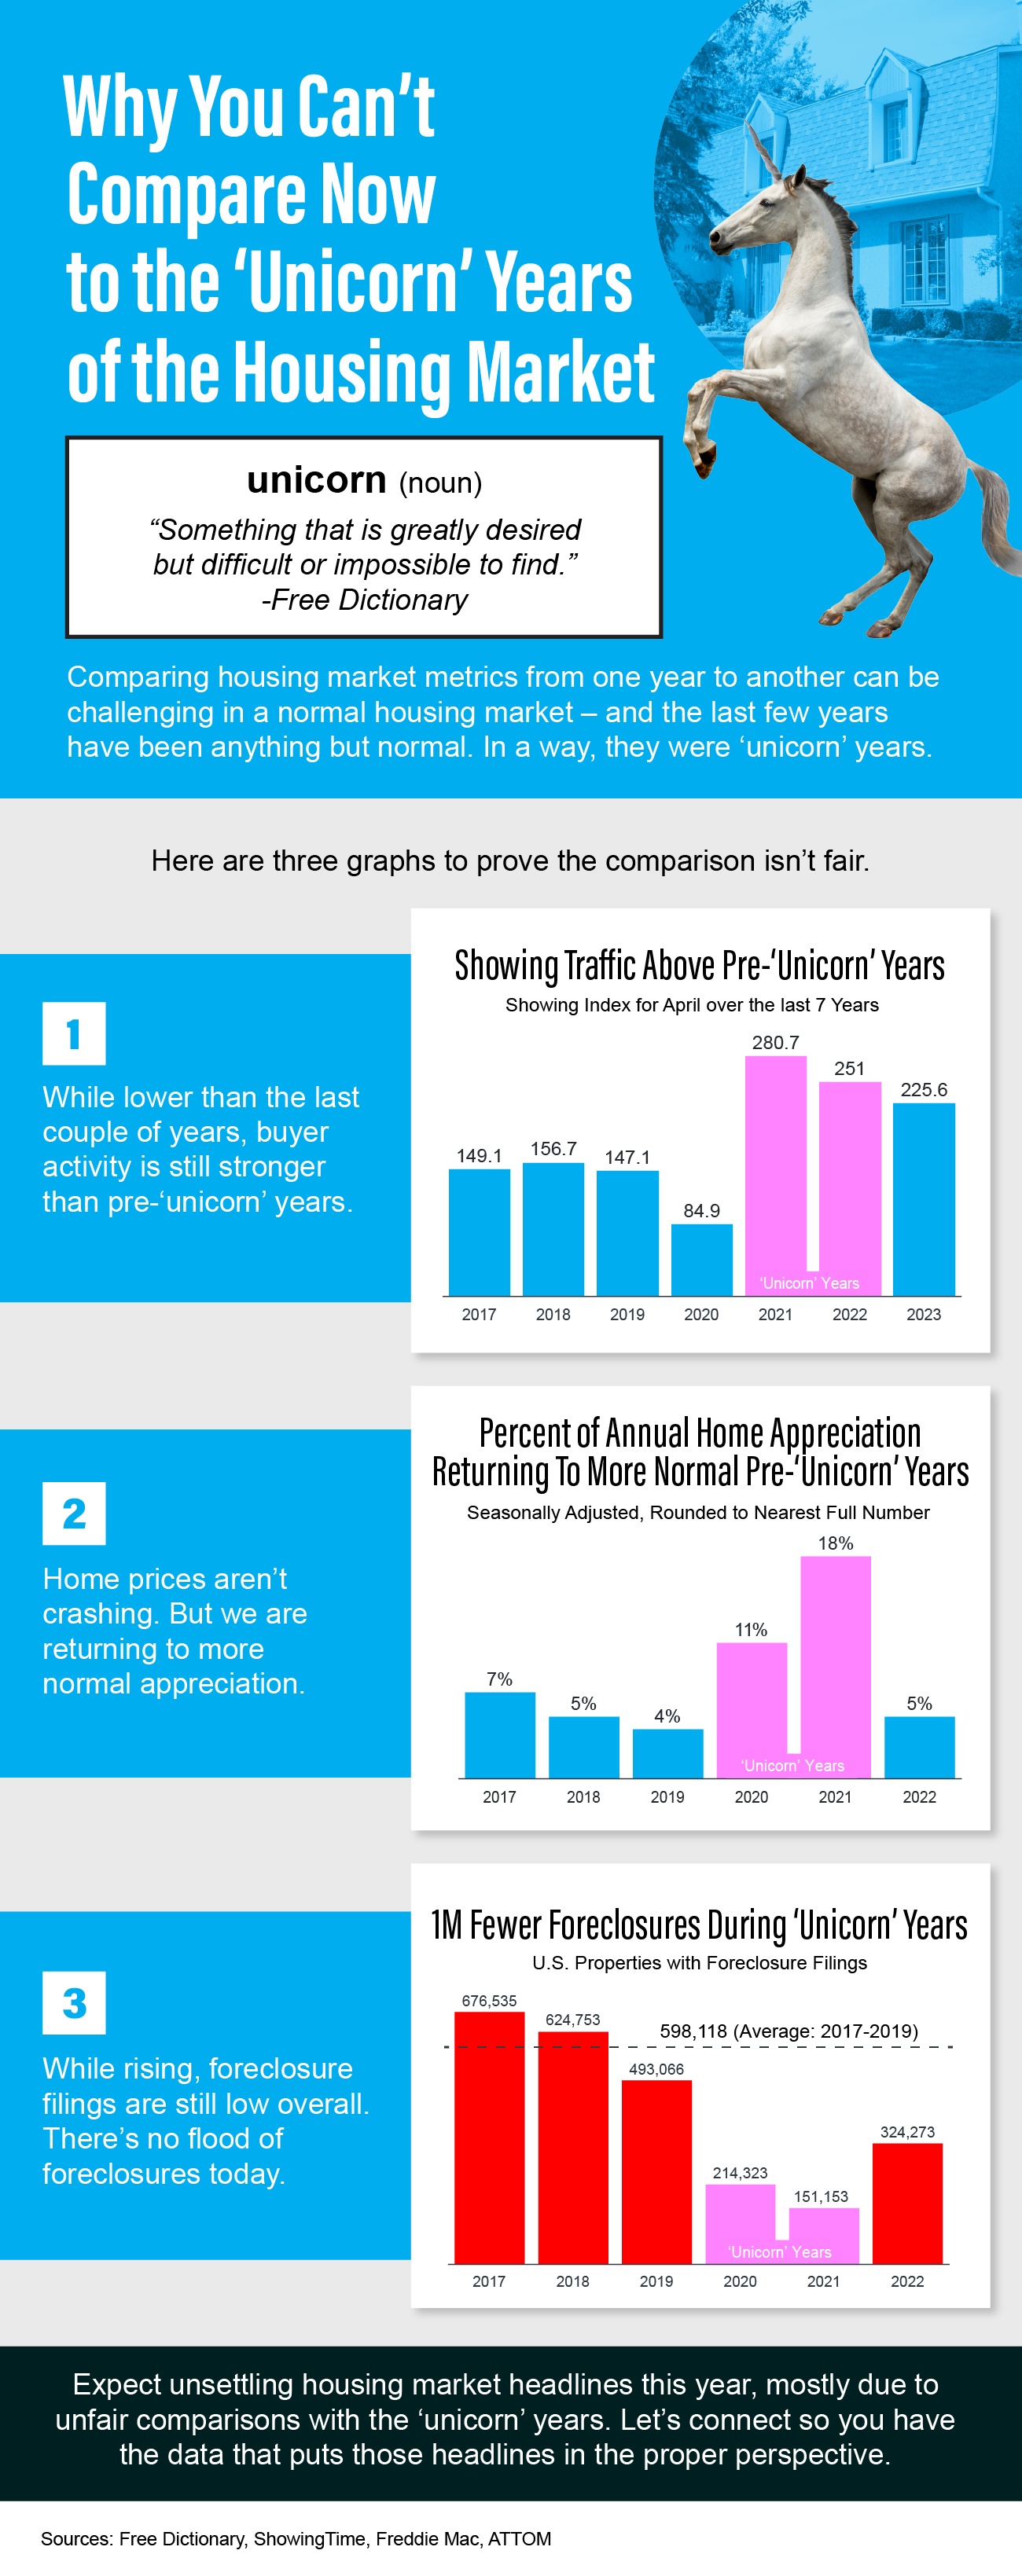
Why You Can’t Compare Now to the ‘Unicorn’ Years of the Housing Market

Some Highlights
- Comparing housing market metrics from one year to another can be challenging in a normal housing market – and the last few years have been anything but normal. In a way, they were ‘unicorn’ years.
- Expect unsettling housing market headlines this year, mostly due to unfair comparisons with the ‘unicorn’ years.
- If you’re looking to buy or sell a home in the San Antonio area, let’s connect so I can share the data that puts those headlines in the proper perspective.
Read Beyond the Dramatic Headlines!
You’ve probably seen some of those clickbait headlines…
“Is the housing market heading for a crash?” “Is there a wave of foreclosures ahead?” “Foreclosure filings rose 115% in the past year.”
While foreclosures are up year-over-year, historical context is essential to understanding the full picture.
There are more foreclosures now compared to during the pandemic but that’s because foreclosures were paused during the pandemic. However, the number of foreclosures is still well below what the housing market has seen in a more typical year, like 2017-2019.
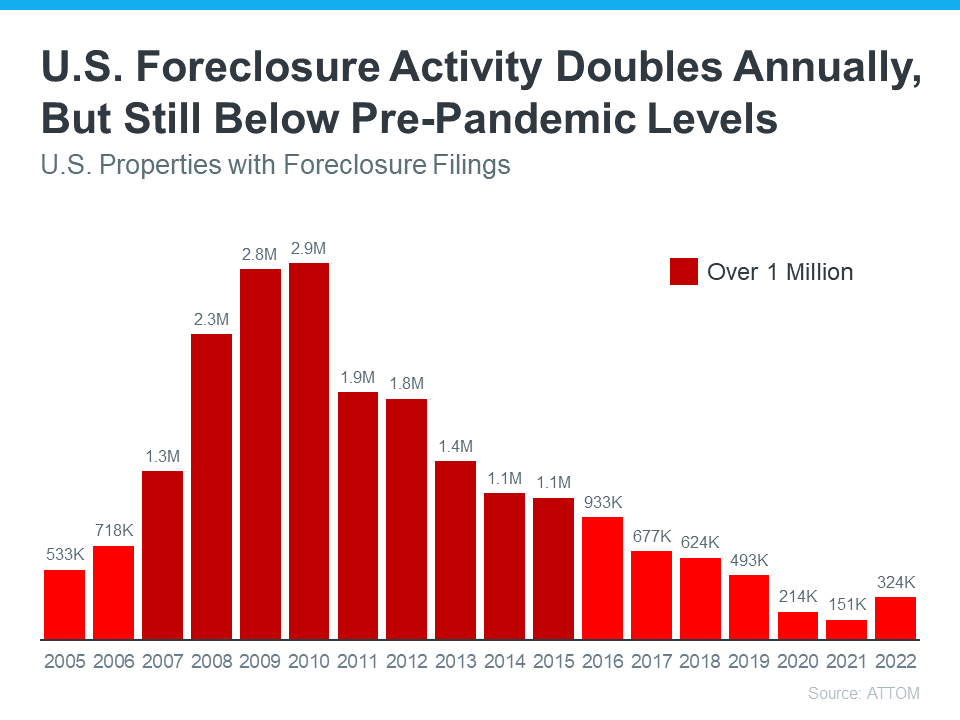
ATTOM, a leading curator of real estate data nationwide for land and property data released it’s year-end 2022, US foreclosure market report, shows foreclosure filings, default notices, scheduled auctions and bank repossessions were up 115% from 2021 but actually down 34% from 2019 before the pandemic shook up the market.
“Foreclosure filings in 2022 were also down 89% percent from a peak of nearly 2.9 million in 2010.”
Another major difference is that most homeowners today have enough equity to sell their homes instead of facing foreclosure.
Due to rapidly rising home prices over the last two years, the average homeowner has gained significant amounts of equity in their home. And if they’ve stayed in their homes even longer, they may have even more equity than they realize.
CoreLogic recently reported that in the 3rd quarter of 2022, US homeowners with a mortgage gained an average of $34.3 thousand dollars in equity which was a 15.8% increase year over year.
As Ksenia Potapov, Economist at First American recently stated – “Homeowners have very high levels of tappable home equity today, providing a cushion to withstand potential price declines, but also preventing housing distress from turning into a foreclosure… the result will likely be more of a foreclosure ‘trickle’ than a ‘tsunami.”
For the second quarter in a row, the mortgage delinquency rate fell to its lowest level since MBA’s survey began in 1979, declining to 3.45%. Foreclosure starts and loans in the process of foreclosure also dropped in the third quarter to levels further below their historical averages.
Over the next year, while we can we can still expect an increase in foreclosures from the record lows during the moratorium perios, as market expert, Bill McBride says,
“there will not be a huge wave of distress sales as happened following the housing bubble. The distressed sales during the housing bus led to cascading price declines, and that will not happen this time.” – Bill McBride, Chief Financial Analysts, Bankrate.com
The Bottom Line is that, today’s housing market is nothing like the real estate market 15 years ago. If you’re a buyer right now, this may be the chance you’ve been waiting for.
If you are considering buying or selling a home in the San Antonio area and are looking for a trusted professional to help you reach your real estate goals, contact Trudy Edwards, Realtor with True SA Real Estate Team, Keller Williams Heritage
Is There a Wave of Foreclosures on the Horizon?
Why You Shouldn’t Fear Today’s Foreclosure Headlines

If you’ve seen recent headlines about foreclosures surging in the housing market, you’re certainly not alone. There’s no doubt, the stories in the media can be pretty confusing right now. They may even make you think twice about buying a home for fear that prices could crash. The reality is, the data shows a foreclosure crisis is not where the market is headed, and understanding what that really means is mission critical if you want to know the truth about what’s happening today. Here’s a deeper look.
According to the Year-End 2022 U.S. Foreclosure Market Report from ATTOM, foreclosure filings are up 115% from 2021, but down 34% from 2019. As media headlines grab onto this 115% increase, it’s more important than ever to put that percentage into context.
While the number of foreclosure filings did more than double last year, we need to remember why that happened and how it compares to more normal, pre-pandemic years in the market. Thanks to the forbearance program and other relief options for homeowners, foreclosure filings were down to record-low levels in 2020 and 2021, so any increase last year is — no surprise — a jump up. Rick Sharga, Executive VP of Market Intelligence at ATTOM, notes:
“Eighteen months after the end of the government’s foreclosure moratorium, and with less than five percent of the 8.4 million borrowers who entered the CARES Act forbearance program remaining, foreclosure activity remains significantly lower than it was prior to the COVID-19 pandemic. It seems clear that government and mortgage industry efforts during the pandemic, coupled with a strong economy, have helped prevent millions of unnecessary foreclosures.”
Clearly, these options meant millions of homeowners could stay in their homes, allowing them to get back on their feet during a very challenging period. With home values rising at the same time, many homeowners who may have found themselves facing foreclosure under other circumstances were able to leverage their equity and sell their houses rather than face foreclosure, and that trend continues today.
And remember, as the graph below shows, foreclosures today are far below the record-high 2.9 million that were reported in 2010 when the housing market crashed.
So, while foreclosures are rising, keeping perspective in mind is key. As Bill McBride, Founder and Author of Calculated Risk, noted just last week:
“The bottom line is there will be an increase in foreclosures over the next year (from record low levels), but there will not be a huge wave of distressed sales as happened following the housing bubble. The distressed sales during the housing bust led to cascading price declines, and that will not happen this time.”
Bottom Line
Right now, putting the data into context is more important than ever. While the housing market is experiencing an expected rise in foreclosures, it’s nowhere near the crisis levels seen when the housing bubble burst, and that won’t lead to a crash in home prices.
Are We in a Housing Bubble? Here Are Four Reasons That This is Not a Housing Bubble
4 Simple Graphs Showing Why This Is Not a Housing Bubble

A recent survey revealed that many consumers believe there’s a housing bubble beginning to form. That feeling is understandable, as year-over-year home price appreciation is still in the double digits. However, this market is very different than it was during the housing crash 15 years ago. Here are four key reasons why today is nothing like the last time.
1. Houses Are Not Unaffordable Like They Were During the Housing Boom
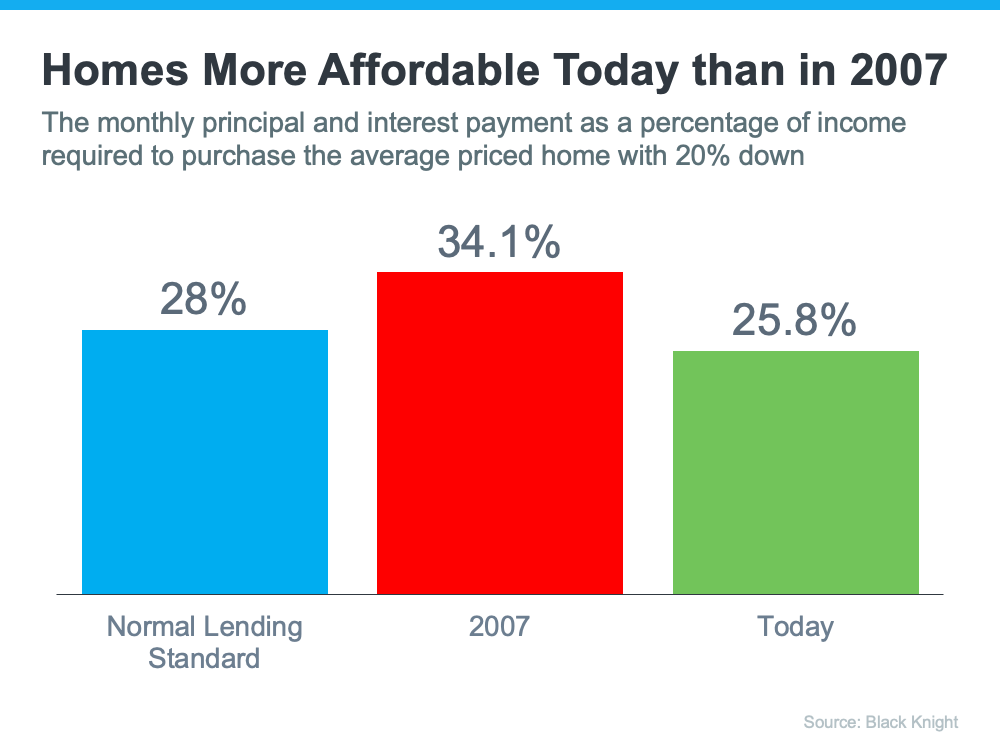
The affordability formula has three components: the price of the home, wages earned by the purchaser, and the mortgage rate available at the time. Conventional lending standards say a purchaser should not spend more than 28% of their gross income on their mortgage payment.
Fifteen years ago, prices were high, wages were low, and mortgage rates were over 6%. Today, prices are still high. Wages, however, have increased, and the mortgage rate, even after the recent spike, is still well below 6%. That means the average purchaser today pays less of their monthly income toward their mortgage payment than they did back then.
In the latest Affordability Report by ATTOM Data, Chief Product Officer Todd Teta addresses that exact point:
“The average wage earner can still afford the typical home across the U.S., but the financial comfort zone continues shrinking as home prices keep soaring and mortgage rates tick upward.”
Affordability isn’t as strong as it was last year, but it’s much better than it was during the boom. Here’s a chart showing that difference:
If costs were so prohibitive, how did so many homes sell during the housing boom?
2. Mortgage Standards Were Much More Relaxed During the Boom
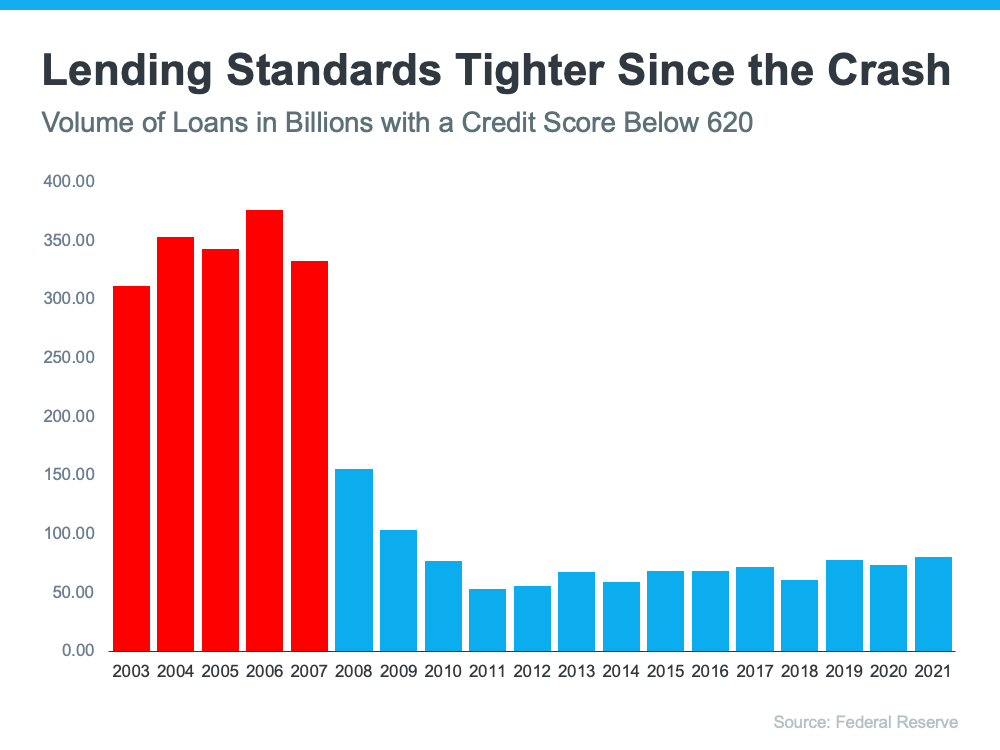
During the housing bubble, it was much easier to get a mortgage than it is today. As an example, let’s review the number of mortgages granted to purchasers with credit scores under 620. According to credit.org, a credit score between 550-619 is considered poor. In defining those with a score below 620, they explain:
“Credit agencies consider consumers with credit delinquencies, account rejections, and little credit history as subprime borrowers due to their high credit risk.”
Buyers can still qualify for a mortgage with a credit score that low, but they’re considered riskier borrowers. Here’s a graph showing the mortgage volume issued to purchasers with a credit score less than 620 during the housing boom, and the subsequent volume in the 14 years since.
Mortgage standards are nothing like they were the last time. Purchasers that acquired a mortgage over the last decade are much more qualified. Let’s take a look at what that means going forward.
3. The Foreclosure Situation Is Nothing Like It Was During the Crash
The most obvious difference is the number of homeowners that were facing foreclosure after the housing bubble burst. The Federal Reserve issues a report showing the number of consumers with a new foreclosure notice. Here are the numbers during the crash compared to today:
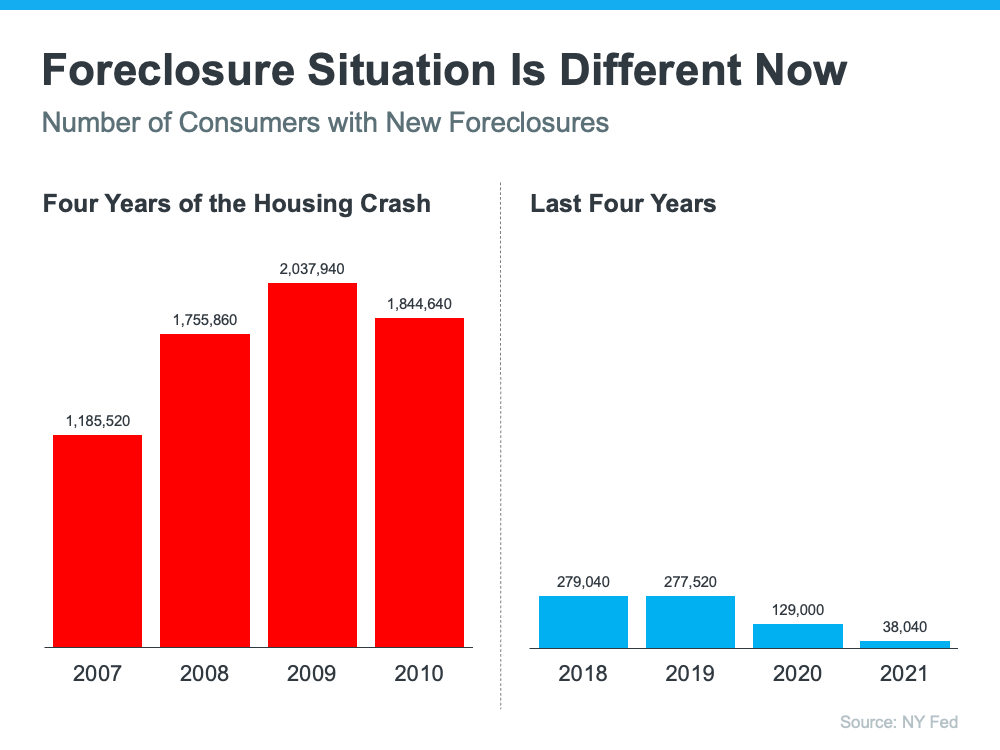
There’s no doubt the 2020 and 2021 numbers are impacted by the forbearance program, which was created to help homeowners facing uncertainty during the pandemic. However, there are fewer than 800,000 homeowners left in the program today, and most of those will be able to work out a repayment plan with their banks.
Rick Sharga, Executive Vice President of RealtyTrac, explains:
“The fact that foreclosure starts declined despite hundreds of thousands of borrowers exiting the CARES Act mortgage forbearance program over the last few months is very encouraging. It suggests that the ‘forbearance equals foreclosure’ narrative was incorrect.”
Why are there so few foreclosures now? Today, homeowners are equity rich, not tapped out.
In the run-up to the housing bubble, some homeowners were using their homes as personal ATM machines. Many immediately withdrew their equity once it built up. When home values began to fall, some homeowners found themselves in a negative equity situation where the amount they owed on their mortgage was greater than the value of their home. Some of those households decided to walk away from their homes, and that led to a rash of distressed property listings (foreclosures and short sales), which sold at huge discounts, thus lowering the value of other homes in the area.
Homeowners, however, have learned their lessons. Prices have risen nicely over the last few years, leading to over 40% of homes in the country having more than 50% equity. But owners have not been tapping into it like the last time, as evidenced by the fact that national tappable equity has increased to a record $9.9 trillion. With the average home equity now standing at $300,000, what happened last time won’t happen today.
As the latest Homeowner Equity Insights report from CoreLogic explains:
“Not only have equity gains helped homeowners more seamlessly transition out of forbearance and avoid a distressed sale, but they’ve also enabled many to continue building their wealth.”
There will be nowhere near the same number of foreclosures as we saw during the crash. So, what does that mean for the housing market?
4. We Don’t Have a Surplus of Homes on the Market – We Have a Shortage
The supply of inventory needed to sustain a normal real estate market is approximately six months. Anything more than that is an overabundance and will causes prices to depreciate. Anything less than that is a shortage and will lead to continued price appreciation. As the next graph shows, there were too many homes for sale from 2007 to 2010 (many of which were short sales and foreclosures), and that caused prices to tumble. Today, there’s a shortage of inventory, which is causing the acceleration in home values to continue.
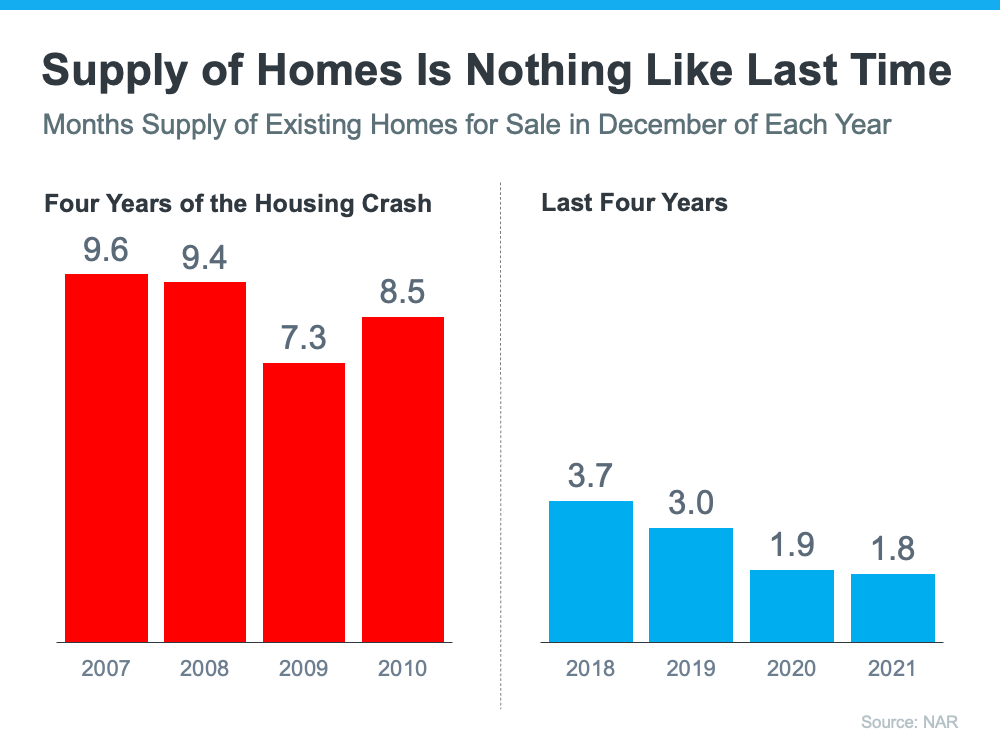
Inventory is nothing like the last time. Prices are rising because there’s a healthy demand for homeownership at the same time there’s a shortage of homes for sale.
Bottom Line
If you’re worried that we’re making the same mistakes that led to the housing crash, the graphs above show data and insights to help alleviate your concerns.
There Won’t Be a Wave of Foreclosures in the Housing Market
When mortgage forbearance plans were first announced and the pandemic surged through the country in early 2020, many homeowners were allowed to pause their mortgage payments. Some analysts were concerned that once the forbearance program ended, the housing market would experience a wave of foreclosures like what happened after the housing bubble 15 years ago. Here’s a look at why that isn’t the case.

1. There Are Fewer Homeowners in Trouble This Time
After the last housing crash, over nine million households lost their homes to a foreclosure, short sale, or because they gave it back to the bank. Many believed millions of homeowners would face the same fate again this time.
However, today’s data shows that most homeowners exited their forbearance plan either fully caught up on payments or with a plan from the bank that restructured their loan in a way that allowed them to start making payments again. The latest data from the Mortgage Bankers Association (MBA) studies how people exited the forbearance program from June 2020 to November 2021.
Here are those findings:
38.6% left the program paid in full
- 19.9% made their monthly payments during the forbearance period
- 11.8% made up all past-due payments
- 6.9% paid off the loan in full
44% negotiated work-out repayment plans
- 29.1% received a loan deferral
- 14.1% received a loan modification
- 0.8% arranged a different repayment plan
0.6% sold as a short sale or did a deed-in-lieu
16.8% left the program still in trouble and without a loss mitigation plan in place
2. Those Left in the Program Can Still Negotiate a Repayment Plan
As of last Friday, the total number of mortgages still in forbearance stood at 890,000. Those who remain in forbearance still have the chance to work out a suitable plan with the servicing company that represents their lender. And the servicing companies are under pressure to do just that by both federal and state agencies.
Rick Sharga, Executive Vice President at RealtyTrac, says in a recent tweet:
“The [Consumer Financial Protection Bureau] and state [Attorneys General] look like they’re adopting a ‘zero tolerance’ approach to mortgage servicing enforcement. Likely that this will limit #foreclosure activity for a good part of 2022, while servicers explore all possible loss [mitigation] options.”
For more information, read the warning issued by the Attorney General of New York State.
3. Most Homeowners Have More Than Enough Equity To Sell Their Homes
For those who can’t negotiate a solution and the 16.8% who left the forbearance program without a work-out, many will have enough equity to sell their homes and leave the closing with cash instead of facing foreclosures.
Due to rapidly rising home prices over the last two years, the average homeowner has gained record amounts of equity in their home. As Frank Martell, President & CEO of CoreLogic, explains:
“Not only have equity gains helped homeowners more seamlessly transition out of forbearance and avoid a distressed sale, but they’ve also enabled many to continue building their wealth.”
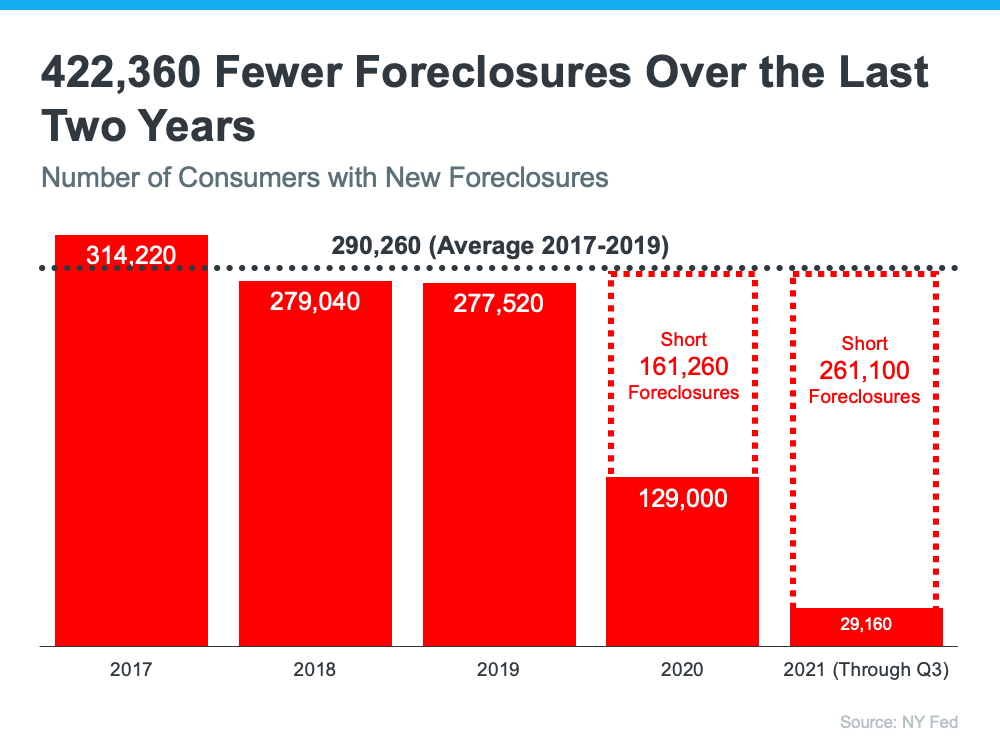
4. There Have Been Far Fewer Foreclosures Over the Last Two Years
One of the seldom-reported benefits of the forbearance program was that it allowed households experiencing financial difficulties prior to the pandemic to enter the program. It gave those homeowners an extra two years to get their finances in order and work out a plan with their lender. That prevented over 400,000 foreclosures that normally would have come to the market had the new forbearance program not been available. Otherwise, the real estate market would have had to absorb those foreclosures. Here’s a graph depicting this data:
5. The Current Market Can Easily Absorb Over a Million New Listings
When foreclosures hit the market in 2008, they added to the oversupply of houses that were already for sale. That resulted in over a nine-month supply of listings, and anything over a six-month supply can cause prices to depreciate.
It’s exactly the opposite today. The latest Existing Home Sales Report from the National Association of Realtors (NAR) reveals:
“Total housing inventory at the end of November amounted to 1.11 million units, down 9.8% from October and down 13.3% from one year ago (1.28 million). Unsold inventory sits at a 2.1-month supply at the current sales pace, a decline from both the prior month and from one year ago.”
A balanced market would have approximately a six-month supply of inventory. At 2.1 months, the market is severely understocked. Even if one million homes enter the market, there still won’t be enough inventory to meet the current demand.
Bottom Line
The end of the forbearance plan will not cause any upheaval in the housing market. Sharga puts it best:
“The fact that foreclosure starts declined despite hundreds of thousands of borrowers exiting the CARES Act mortgage forbearance program over the last few months is very encouraging. It suggests that the ‘forbearance equals foreclosure’ narrative was incorrect. . . .”

